The Performance Rating tracker will give you insights into your employees’ ratings over time. This data is taken from the Overall Rating in a performance review cycle.
To get the most value from this feature, we recommend making sure your data is clean and up to date and that you’re using standardized terms for departments, teams, locations, etc. Here’s a guide to best practices for your company’s data.
Using the feature
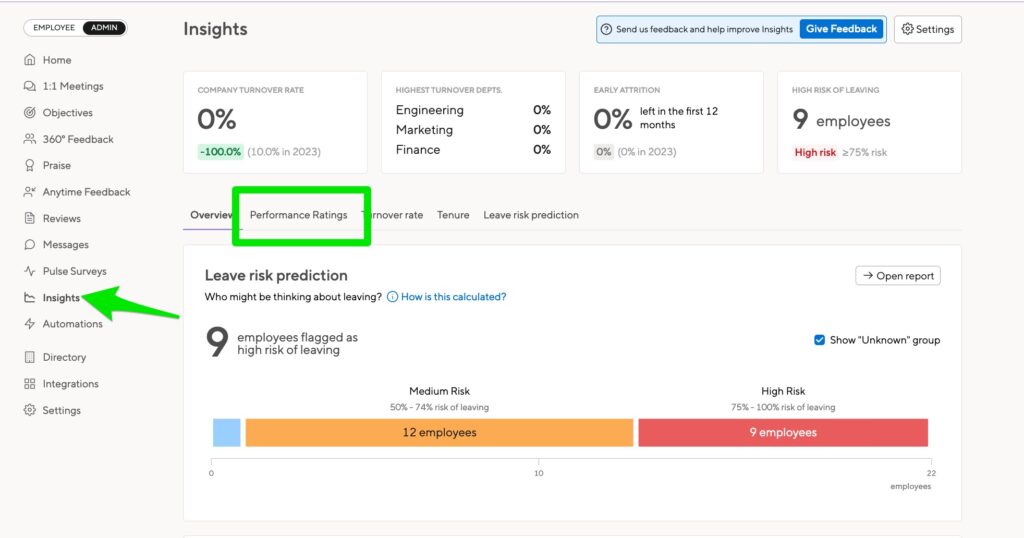
Click Insights > Performance Ratings to get started:
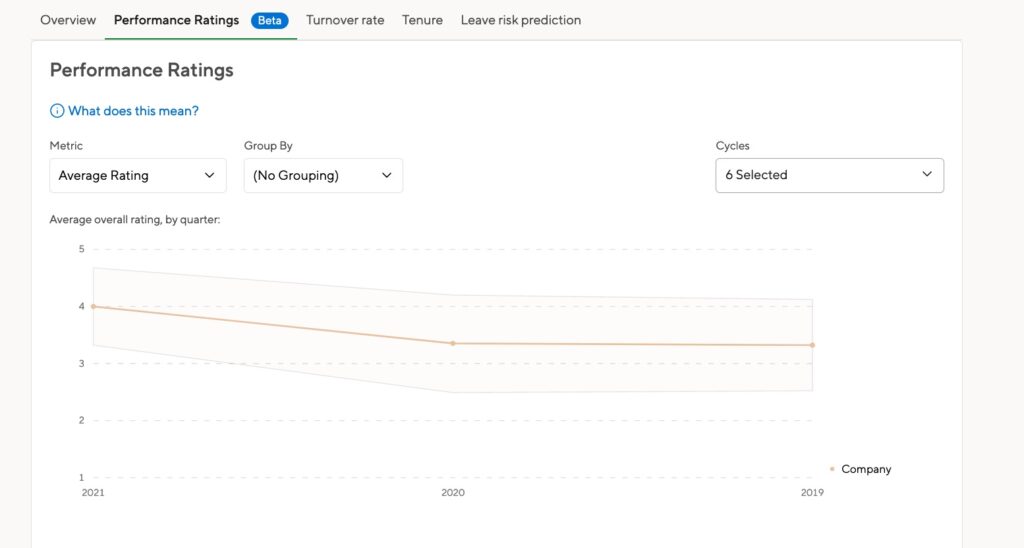
The Performance Ratings tab will show you the averages and the trends of the Overall Ratings taken from each performance review cycle. It will only count the Overall Ratings if both parties have signed.
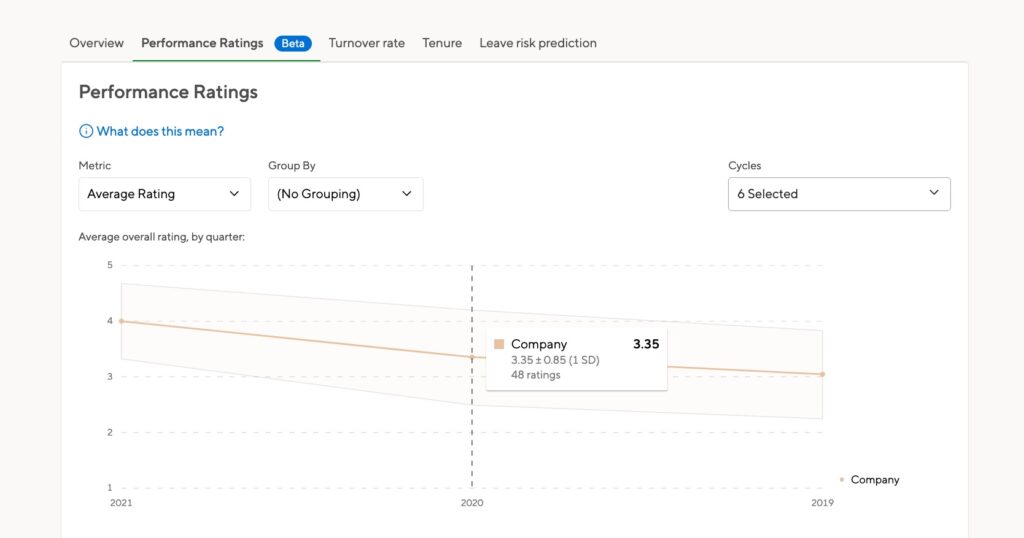
Hover over the graph to get details about a particular segment.
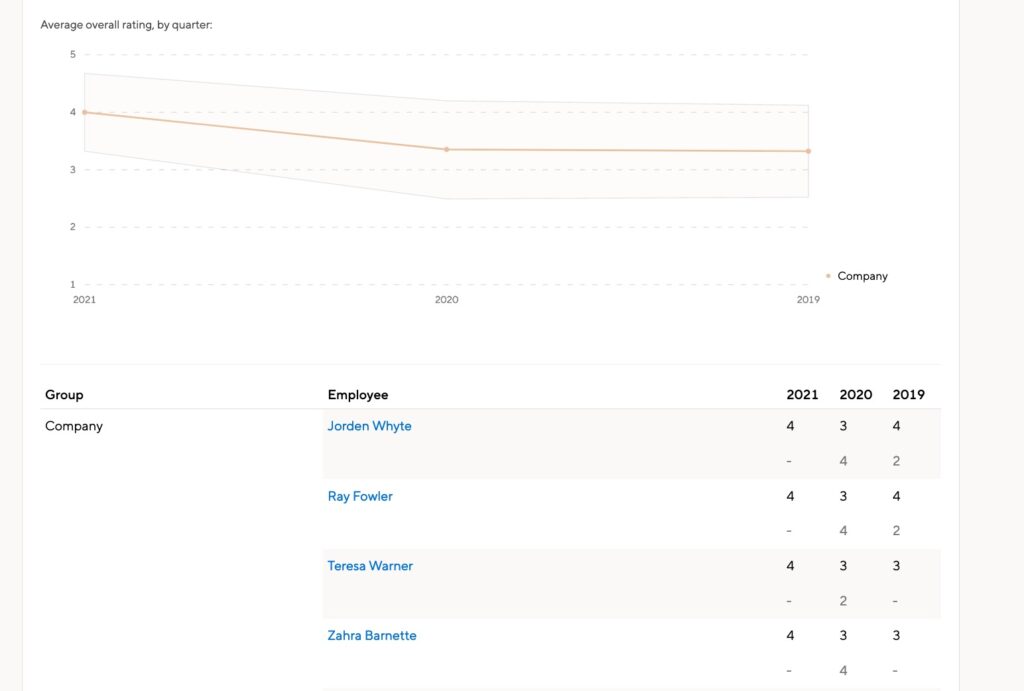
Scroll down the page to see each employee and their Overall Rating scores. For now, your employees are listed randomly. The list includes every employee, active and deactivated.
Filtering your data
By default, we’ll show you the average of every rating from every cycle. However, you can filter your employees by their department, location, gender, or location. You can also see the ratings for managers or for non-managers.
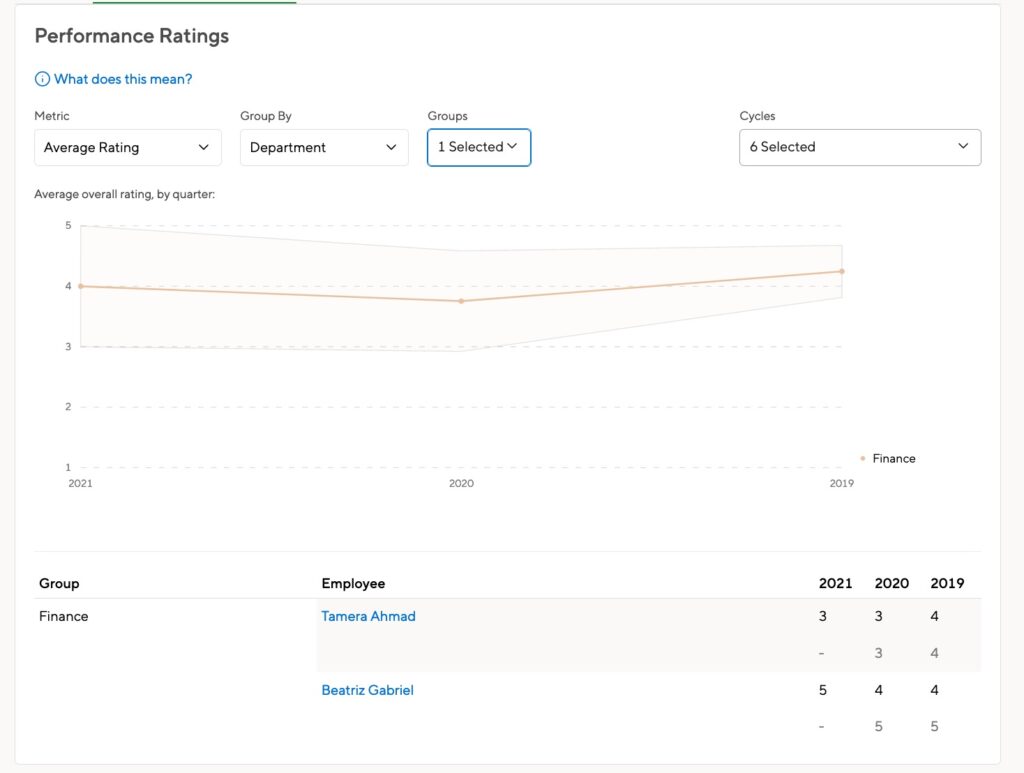
You can also select specific cycles to compare.

A note about permissions
HR Admins can only see the data for people they would otherwise have access to. So you won’t see the people in your management chain in this report.
Cycle Admins will have access to insights, but can only see the data for the cycles in which they have Admin permissions. HR Admins who are not Cycle Admins on will not see the data for those cycles.
This means you might see different data than another coworker, depending on your reporting structure and cycle settings.
Interpreting the data
Average rating
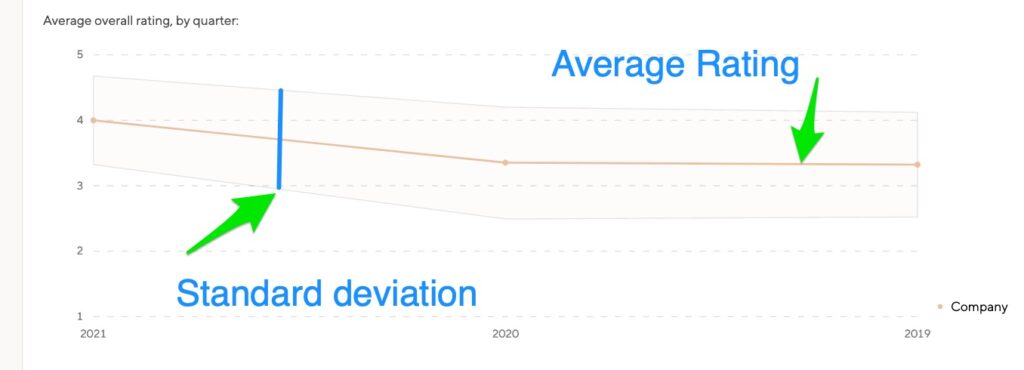
The main line on the graph is the average of all the Overall Ratings submitted in the selected cycles.
The shaded area is the standard deviation, which shows you the amount of variation in the ratings. The larger this range, the more spread out your ratings are.
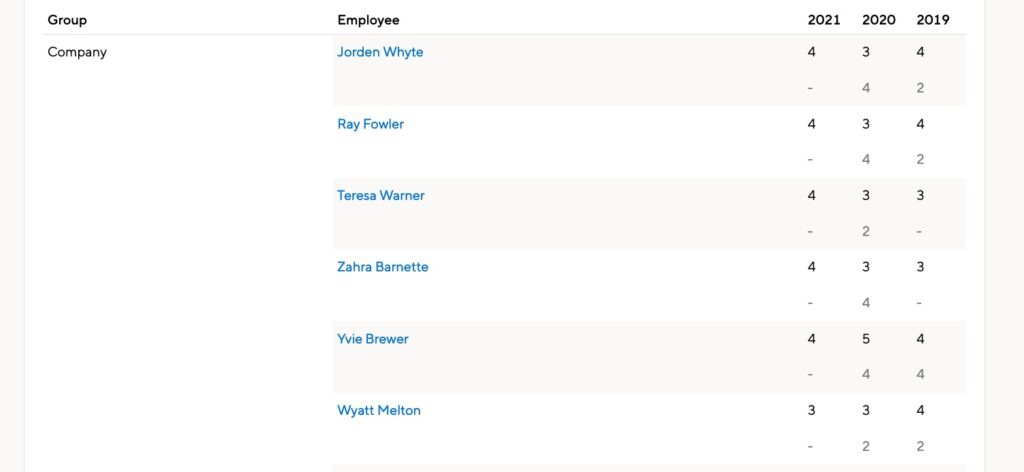
In your list of employees, we’ll display the rating from each cycle they’ve been part of. The most recent cycle is listed at the top.
Note that as you conduct cycles throughout the year, the most recent cycle will change. In the screenshot below, the most recent cycle in 2021 is Q1/Q2, while the most recent cycle in 2020 is Q3/Q4. Keep that in mind as you compare employee performance across the years.
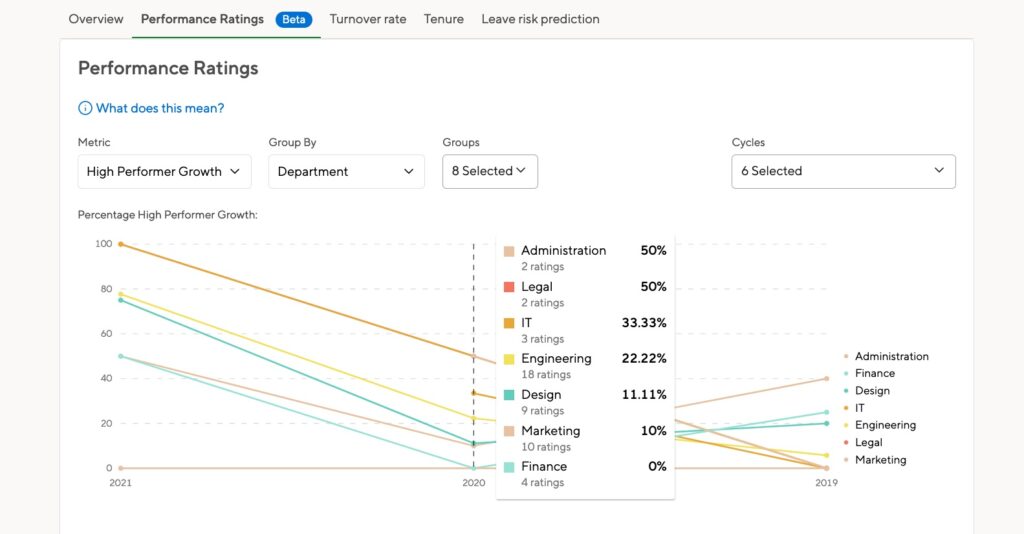
High performer growth
The graph shows a percentage of employees in the quarter or year that went from low performance to high performance.
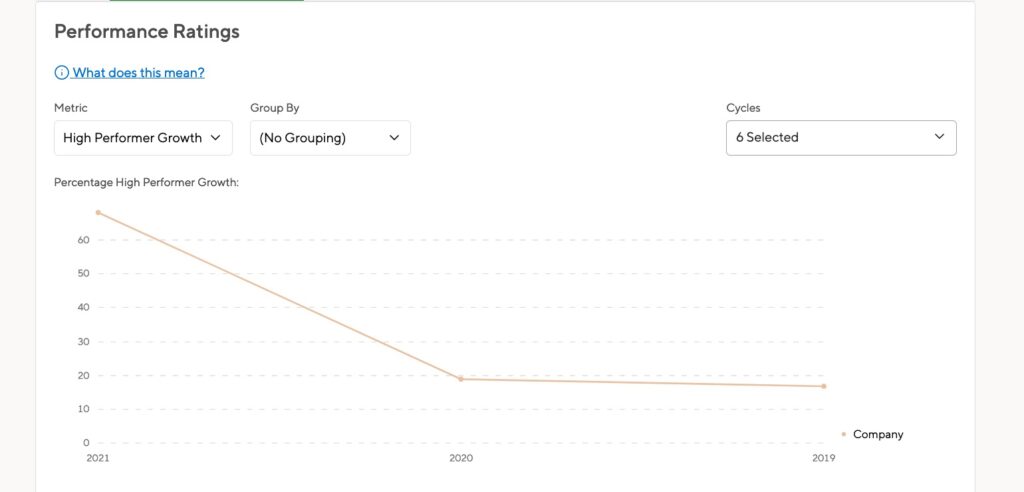
On a 5 point scale, the medium rating is 3. Going from 3 to 4 would take someone from being a low performer to a high performer.

You can filter this data as well. Hover over a segment to see the distribution of high performers within the group.
Your review cycle setup
Rating codes
When you set up your review cycle, you can make edits to the Overall Rating. This includes the public-facing name and the behind-the-scenes code.
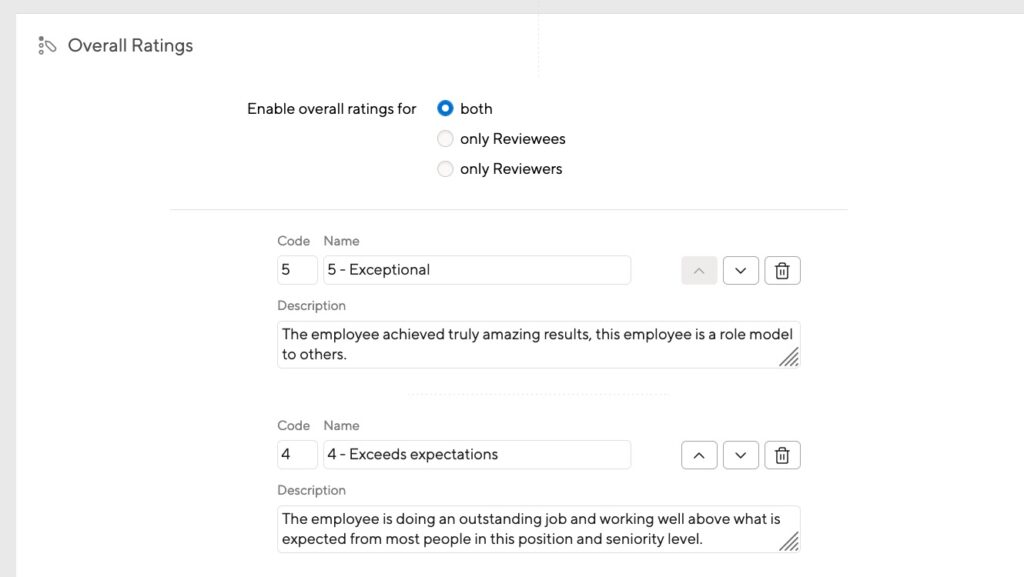
The code is what we use to calculate performance rating averages. So, even if you don’t use numbers in your rating system, you’ll still see numbers in the calculations.
A higher number means a better rating. If you see high performers listed as having low ratings, check your cycle setup. If you’ve used 1 as the code for the highest rating, you’ll need to make some edits and adjust your Overall Rating codes so that the best rating has the highest code number. You can do so even after the cycle has ended. Reach out to us if you have questions about this!
Cycles with different rating scales
If you use different rating scales for your review cycles, we pick the most common scale from all cycles and use that. If you have a 5 point scale for most of your review cycles and a 3 point scale for just a few, we use the 5 point scale for calculation.
This can skew your data, so we recommend filtering your cycles to compare only the cycles that use the same rating scale.
Profile information
The data filters are based on the current profile information. If an employee moves departments or locations, their data moves with them. Their overall rating for the original department or location will now be counted for the new department.